When the expected operation is not performed during the operation of TW100MJ (the same for TW100XR/TW100PC), checking the debug messages is the best way to determine where the problem occurred.
TW100MJ provides the capability to output messages via the serial debug port for each operation.
Debug Port
The debug port of TW100MJ is a UART port.
The default setting of the UART port is as follows and cannot be changed.
| Item | Value |
| Baud Rate | 2Mbps |
| Parity | None |
| Flow Ctrl | None |
Connecting to Debug Port
Using the on-board port
The TW100xx Series modules provide a 4-Pin Hole debug port to allow checking of debug messages in case the system does not provide a connection to the TW100xx module’s debug port after the module has been installed in a separate system.
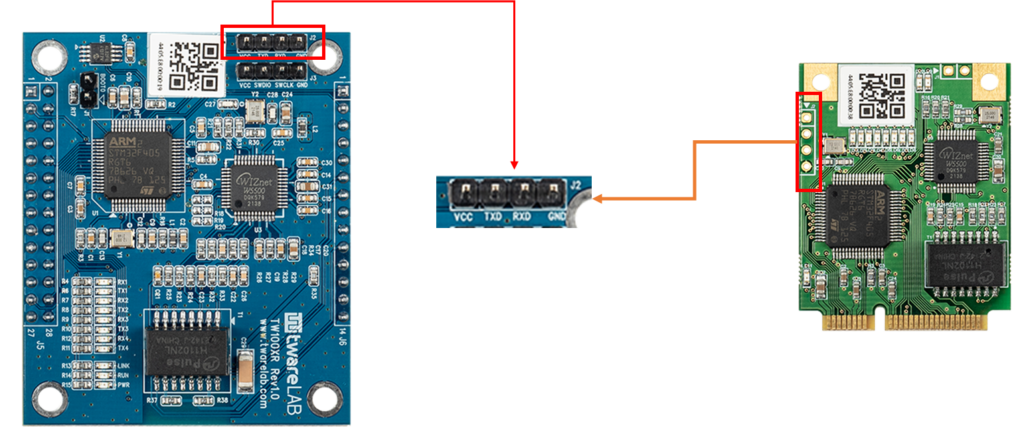
By connecting the 4 Pin Hole to a TTL-to-USB module as shown in the image below, you can view debug messages.
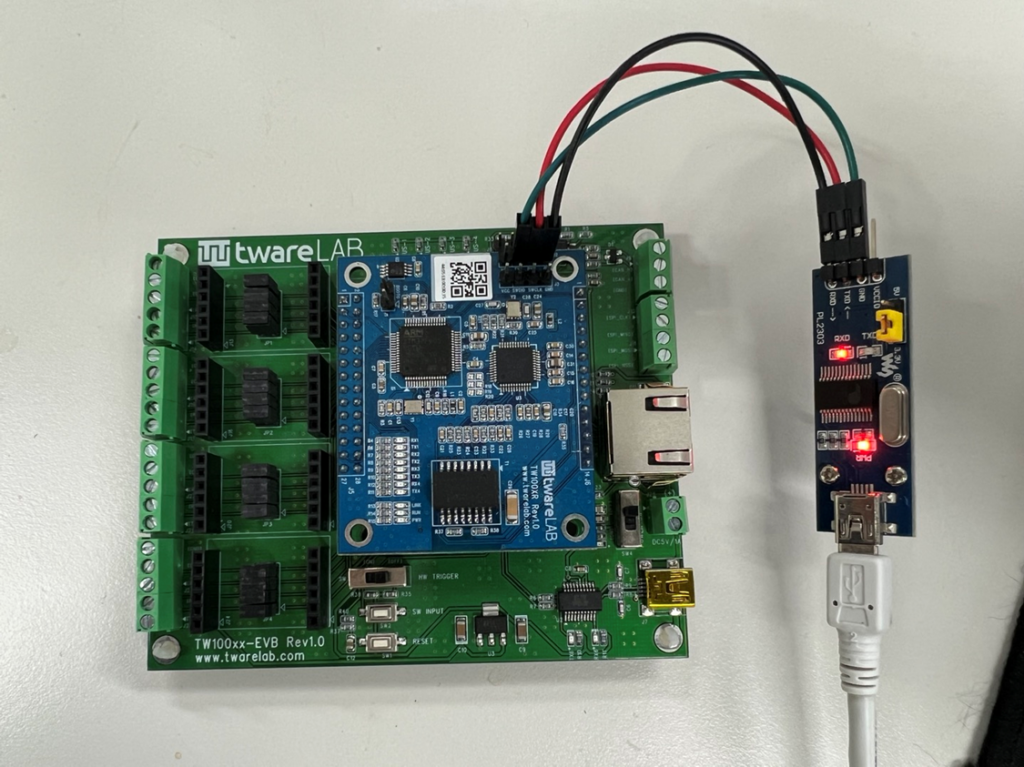
Note that the TTL-to-USB module must support a baud rate of 2Mbps in order to monitor the debug messages.
In case of using Header pin
The Header pins (MiniPCI Connector pins in case of TW100PC) provided can also be used for the Debug Port in order to connect to external systems.
For TW100MJ/TW100XR, the pins for the Debug Port are J6 Pin3 (Console_TX) and J6 Pin4 (Console_RX), and for TW100PC, the pins are Pin25 (Console_TX) and Pin26 (Console_RX).
In EVB(Evalution Board)
The TW100xx EVB has the Debug port connected to the USB Connector (J7) which is also used for power supply.
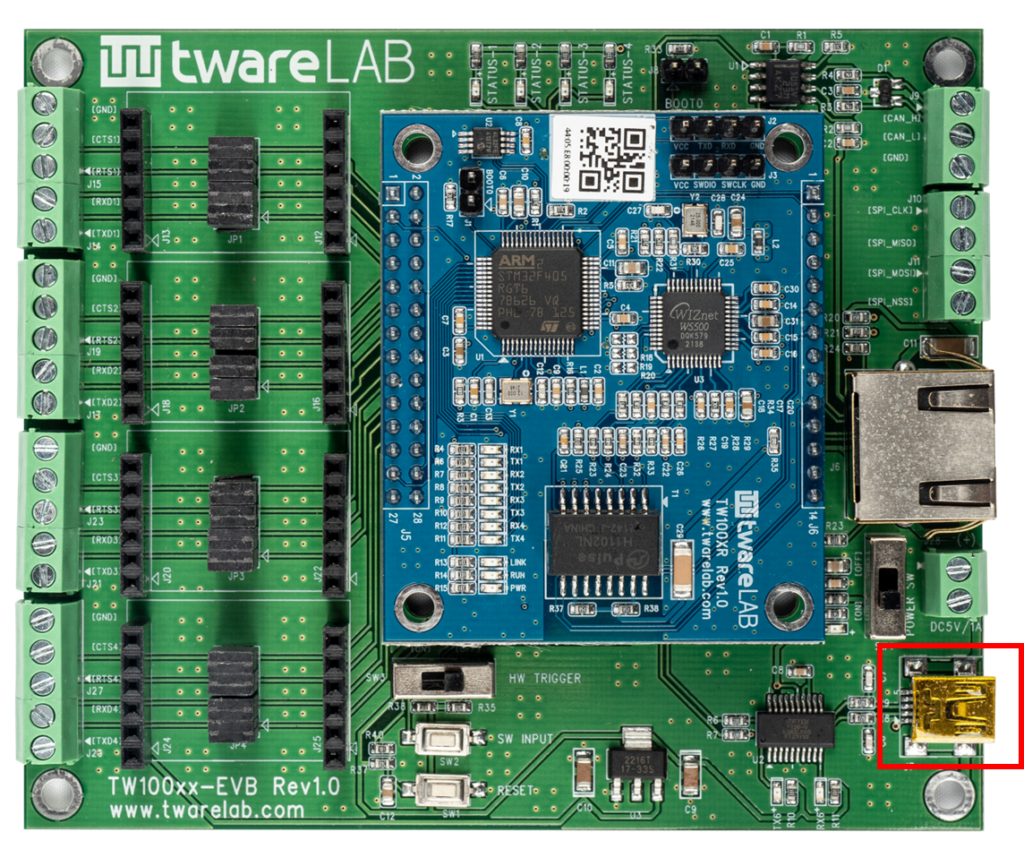
By connecting the USB cable connected to the PC to J7, the serial port will be recognized on the PC, and you can check the Debug messages through this serial port.
Procedure for checking debug messages
Using a terminal program
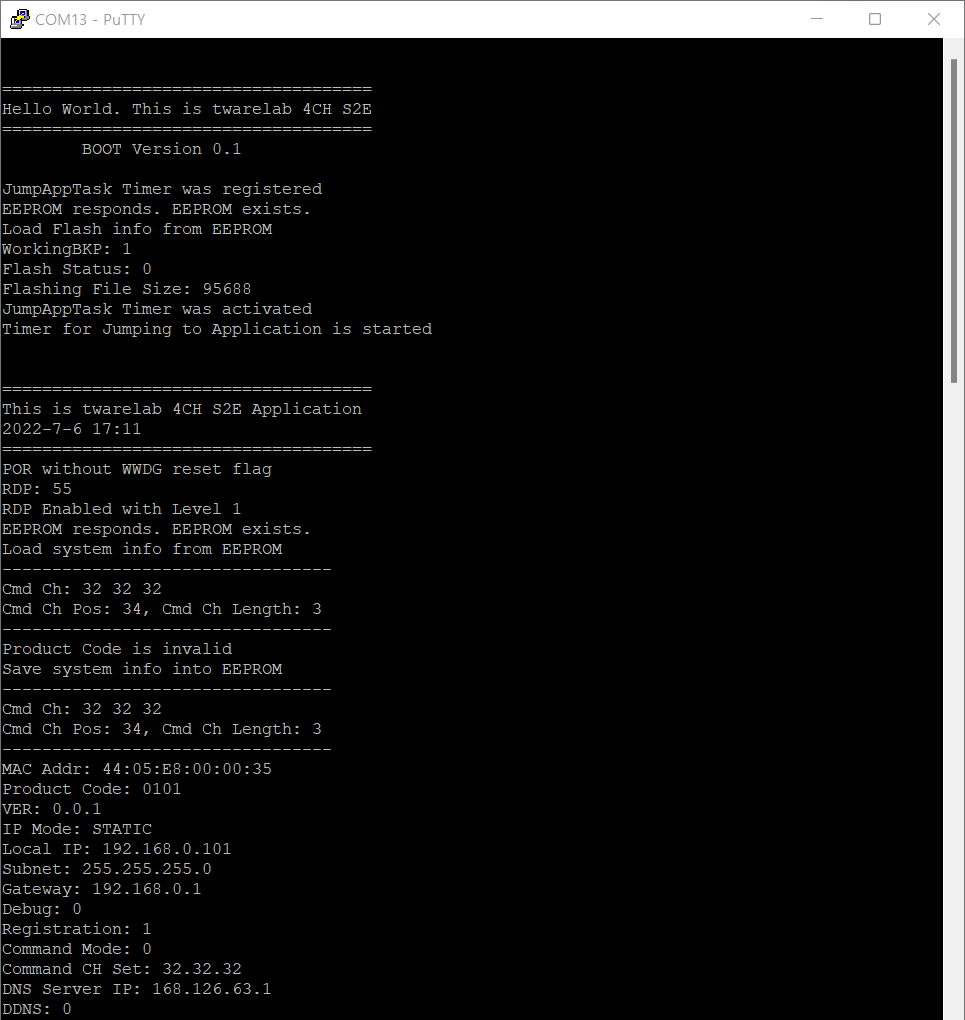
Run any serial terminal program. In this case, PuTTY is used.
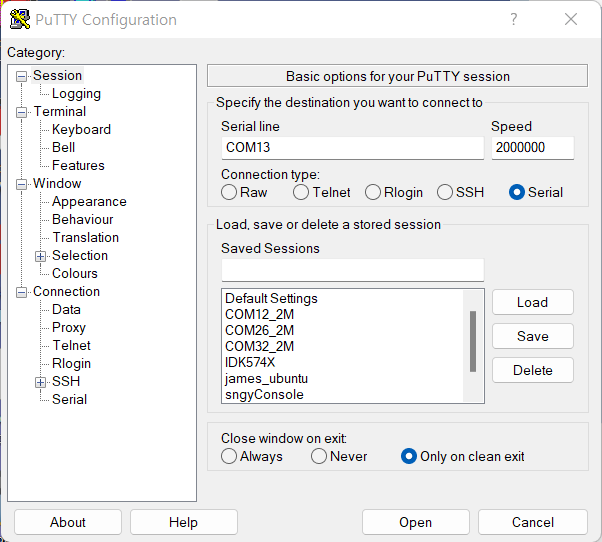
Power-on or Reset Pin Triggering
Apply power to the module or trigger a reset. Then, you can see the debug messages being outputted.
0개의 댓글